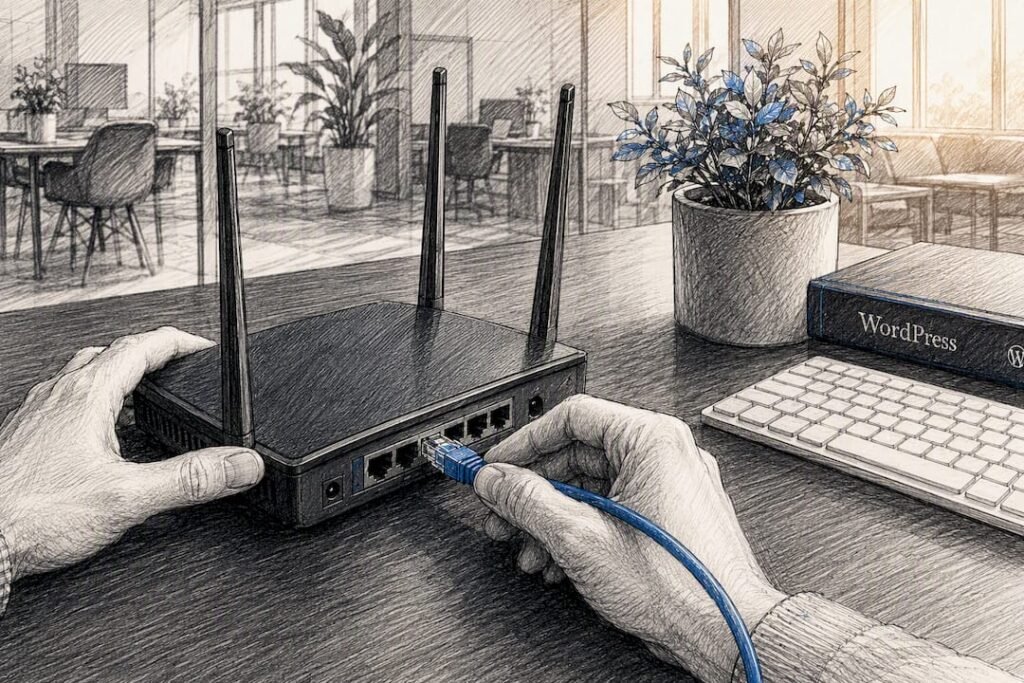
A solid client uptime report has four things: a plain-language executive summary, an uptime percentage with a recent-incident timeline, a response-time highlight, and one prioritized recommendation. Deliver it as a branded monthly PDF with a live dashboard link for anyone who wants the raw numbers, and send outage alerts the moment they happen, not weeks later. Self-hosted monitoring is a legitimate, often preferable choice for agencies that need to keep client data on their own servers.
TL;DR:
- Self-hosted monitoring plugins ensure incident logs and uptime data remain on your infrastructure, offering better control and compliance, especially for EU clients.
- Prioritize incidents that impact revenue, occur during peak hours, or are recurring, and clearly explain their potential effects on conversions or customer experience.
- Use consecutive failure thresholds and detailed alert contexts to minimize false positives and ensure urgent issues are reported promptly with actionable information.
- Automate report generation and scheduling to maintain consistent delivery, and include specific, prioritized recommendations at the end of each report to boost client retention.
- Keep data aligned with the reporting period, position uptime metrics prominently, and customize report detail levels based on the client’s technical expertise.

GrowthWebMonitor: WordPress Uptime Monitoring Plugin for Agencies
Table of Contents
- What Clients Actually Want From Client Uptime Reports in WordPress
- Core Uptime Metrics And Visuals Every Report Needs
- How Should Agencies Architect Their Uptime Monitoring?
- Configuring Alerts That Don’t Cry Wolf
- Report Delivery: Format, Cadence, And The Recommendations That Retain Clients
- How GrowthPlugins Approaches Self-Hosted Monitoring And Reporting
- Integrating Uptime Data Into The Rest Of The Client Report
- Customizing Reports For Different Client Technical Expertise Levels
- Legal And Privacy Considerations When Sharing Uptime Data
- Why The Recommendation Line Is What Actually Keeps Clients
- How GrowthPlugins Helps Agencies Keep Uptime Data On Their Own Servers
- Key Implementation Resources
- Sources
- FAQ
What Clients Actually Want From Client Uptime Reports in WordPress
Clients don’t read uptime reports the way you do. They skim for one thing: did anything break, and are we covered? If your report opens with a grid of response-time percentiles, you’ve already lost them.
The executive summary should do the translating for you. Keep it to two or three sentences: current status, what it meant for the business, and what happens next. Something like: “Your site was available nearly all the time this month, with one brief outage during a low-traffic overnight window that had no measurable impact on checkout activity. We recommend upgrading to a faster hosting tier to shave 200 milliseconds off average load time before your holiday traffic spike.”
That’s it. No jargon, no raw log dumps.
Picking which incidents to feature matters more than logging every blip. A five-minute outage at 3 a.m. on a B2B site matters far less than a two-minute checkout failure at noon. Rank incidents by business impact first, technical severity second:
- Did it touch a revenue-generating page (cart, checkout, booking form)?
- Did it happen during the client’s peak traffic hours?
- Did it repeat, or was it a one-off network blip?
- Would a customer have noticed, or only a bot crawler?
Every metric you include needs a “so what” attached. Response time went from 400ms to 650ms average? Say what that likely cost in bounce rate or conversions, even in general terms. Clients aren’t paying you to report numbers. They’re paying you to interpret them.
Core Uptime Metrics And Visuals Every Report Needs
The backbone of any client uptime report is straightforward: uptime percentage, an incident timeline, response-time summary, and certificate expiry status. Skip any of these and the report looks incomplete to a technical reviewer, even if the client never notices.
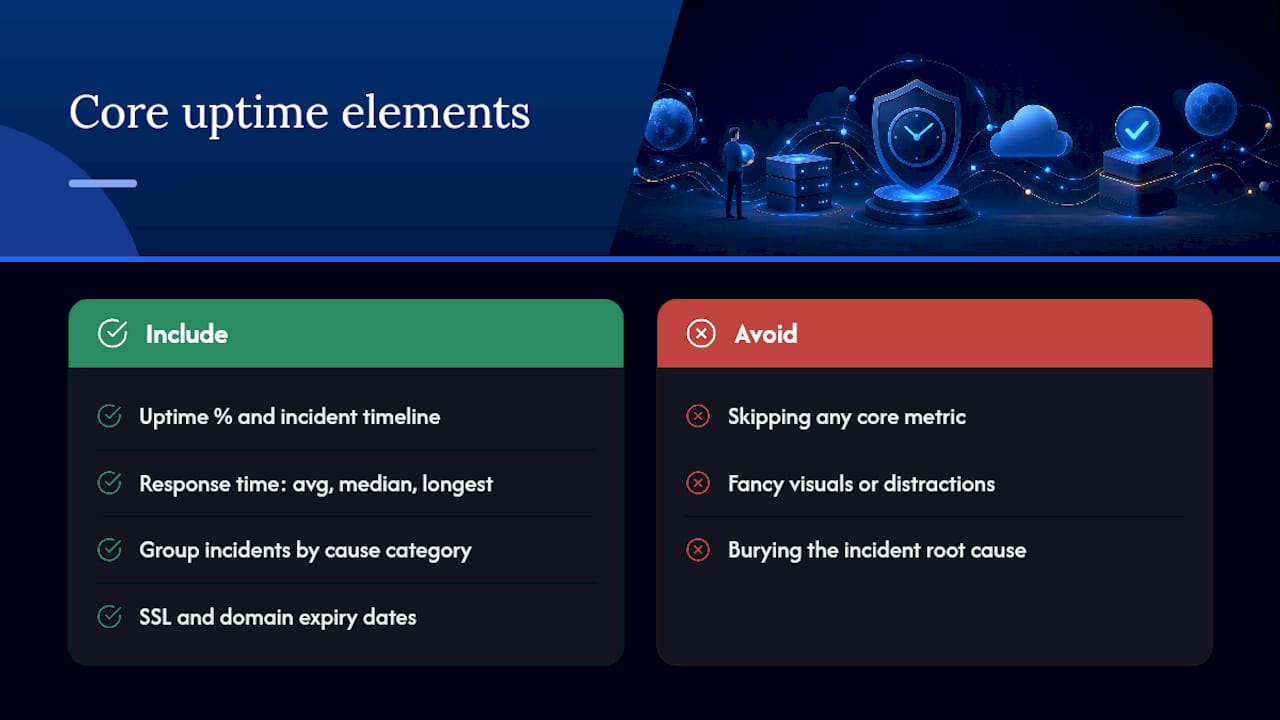
Uptime percentage with incident timeline. State the percentage for the reporting period, then list each incident with start time, end time, and duration. A single line like “March 8, 2:14 AM to 2:26 AM (12 min), server 502 error” tells the whole story without needing a paragraph.
Response time summary. Average, median, and longest response time over the period. Median matters more than average here, since a single 30-second timeout can drag the average up and make a healthy month look shaky.
Incident cause categories. Group incidents by type: HTTP 5xx errors, DNS resolution failures, SSL handshake issues, timeout errors. This turns a random list of red flags into a pattern the client (and you) can act on.
SSL and domain expiry. Include the current certificate expiry date and, separately, the domain registration expiry date. These two get missed constantly and cause the kind of outage that makes an agency look careless.
On a client site that logged 99.94% uptime last quarter, the single reported incident traced back to a delayed SSL renewal, not a server failure, which is exactly the kind of root cause a good report should surface instead of burying.
Keep the visuals minimal: a sparkline for uptime trend, a horizontal timeline bar for incidents, and single-number callouts for the headline metrics. Anything fancier turns into a distraction for a client who just wants to know the site was fine.
How Should Agencies Architect Their Uptime Monitoring?
The checks you run determine what your report can honestly claim. A basic HTTP GET request to the homepage tells you the server responded. It tells you nothing about whether checkout works, whether login is broken, or whether a plugin update silently killed a critical form. Application-path checks, hitting a WooCommerce checkout flow or a login endpoint and confirming the expected content actually loads, catch failures that a homepage-only check will miss entirely.
Here’s how to think through the setup:
- Choose your check type. Run root-URL checks for basic availability and separate application-path checks for anything revenue-critical (cart, checkout, membership login).
- Decide where checks run. Self-hosted WordPress monitoring plugins keep every log entry on your own server, which matters for agencies with strict data-ownership commitments to clients. SaaS-style remote probes offer multi-region redundancy but mean your uptime data lives on someone else’s infrastructure.
- Fix your cron reliability. WP-Cron only fires when a visitor loads a page, so a low-traffic client site can go hours between checks if you rely on it alone. Set up server-side cron to hit wp-cron.php every five minutes, or pair local checks with a remote probe as an edge fallback that still detects a total outage even if the WordPress install itself is unreachable.
- Set failure thresholds. Don’t alert on the first missed check. Require two or three consecutive failures with an automatic retry in between before you call it an incident.
Pro Tip: Test your monitoring setup by intentionally blocking your site’s IP for 90 seconds. If you don’t get an alert within your configured check interval plus retry window, your thresholds are wrong before a real client ever finds out.
Self-hosted plugins like SavaPato Uptime Monitor bundle SSL expiration tracking and webhook alerts directly into the check, so you’re not stitching together three separate tools to get one clean report.
Configuring Alerts That Don’t Cry Wolf
A single missed check is not an outage. It’s usually a network hiccup, a momentary DNS blip, or your monitoring server having a bad five seconds. Treat it as one and you’ll train your team, and eventually your client, to ignore every alert that comes through.
Consecutive-failure rules fix this. Require two to three failed checks in a row, with a short automatic retry between each, before anything gets flagged as downtime. This one setting change eliminates most of the false-positive noise that makes monitoring tools feel unreliable.
When something does qualify as a real incident, route the alert with enough context that whoever picks it up doesn’t have to go digging:
- The exact URL or endpoint that failed, not just “the site.”
- The HTTP status code or error type returned.
- Timestamp of first failure and of each retry.
- A probable-cause note if the pattern is recognizable (recent plugin update, hosting provider maintenance window, DNS change).
- Severity tag: critical (checkout/login down), moderate (non-critical page down), low (slow response, no outage).
Once you’ve verified and fixed the issue, log the resolution. Every incident that shows up in a client report should carry a closure note: what broke, when it was caught, when it was fixed, and what (if anything) changes going forward. An incident with no resolution note looks unfinished to a client reading the report cold.
Automate the routine monthly digest. But for anything tagged critical, send a manual summary the same day it happens rather than waiting for the automated batch. Clients forgive downtime. They don’t forgive finding out about it three weeks later in a PDF.
Report Delivery: Format, Cadence, And The Recommendations That Retain Clients
Monthly cadence works for most retainer relationships: a one-page branded PDF as the primary deliverable, with a link to a live dashboard for anyone who wants to dig into raw data. High-severity outages get their own immediate notification, separate from the monthly cycle, sent through whichever channel the client actually checks, email, Slack, or a webhook into their own project tool.
Plugins built specifically for agency client reporting can pull uptime, SSL status, and update logs into a scheduled, white-labeled PDF automatically, which saves you from manually assembling the same document every month.
The section that actually earns its place in the report is “what we recommend next.” This isn’t optional filler. Guidance on maintenance reporting consistently points to the recommendations block as the single highest-leverage section for keeping a client on retainer, because it’s the only part of the report that talks about the future instead of the past.
Write it with three things every time:
- Priority. Is this urgent, important, or nice-to-have?
- Effort estimate. A rough hours figure or a severity label the client can weigh against the fix.
- A clear next step. “Approve this and we’ll schedule it next week” beats “you might want to consider.”
Pro Tip: Add a short “what we did” appendix below the recommendations. Clients renew agencies whose value they can see, and a two-line list of fixes applied this month makes the invisible work visible.
Keep the language client-facing throughout. Save the stack traces for your internal dashboard.
How GrowthPlugins Approaches Self-Hosted Monitoring And Reporting
Self-hosted monitoring only works as a retention tool if the data collection and the reporting layer talk to each other without manual copy-pasting every month. That’s the gap most agencies hit: the monitoring plugin logs incidents fine, but turning that log into a client-ready PDF becomes a Friday-afternoon chore.
The agencies that stick with self-hosted monitoring long-term are the ones who automate the boring part first, cron reliability and scheduled export, and only then worry about making the PDF look polished.
A practical setup checklist looks like this:
- Install a self-hosted monitoring plugin and confirm server-side cron is firing checks at your chosen interval, not relying on WP-Cron alone.
- Configure webhook alerts to your team’s channel of choice (Slack, email, or a custom endpoint) with severity tagging built in.
- Set a data retention period that matches your client contract, most agencies keep 12 to 24 months of incident history.
- Schedule automated PDF generation on a monthly cycle, timed a few days before your regular client check-in call.
Data ownership is the real draw here. When uptime logs, SSL expiry records, and incident histories sit on your own server instead of a third-party SaaS dashboard, you control retention, access, and export without depending on another company’s uptime for your own reporting tool to work. That’s a meaningful GDPR-friendly posture for agencies with EU clients or contracts that specify data locality.
GrowthPlugins centralizes this kind of client-facing operational data, alongside project tracking and client portal access, inside the same self-hosted dashboard agencies already use for project management, so uptime data doesn’t live in a fourth disconnected tool.
Integrating Uptime Data Into The Rest Of The Client Report
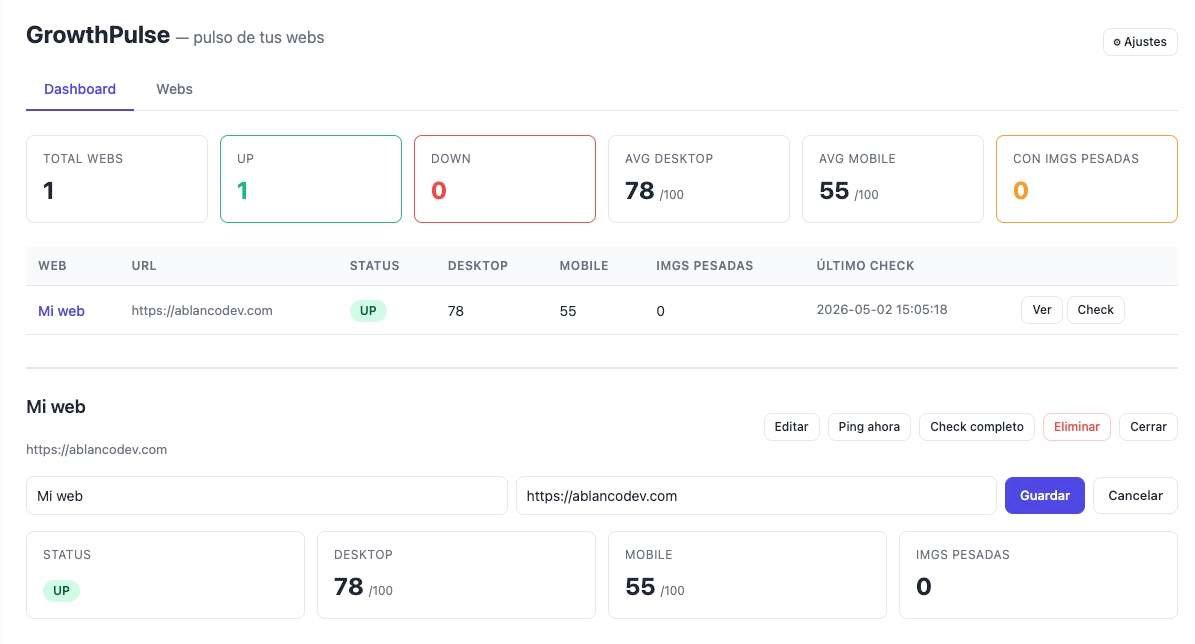
Uptime numbers rarely stand alone in a maintenance report. They sit next to plugin update logs, backup confirmations, security scan results, and performance scores. The trick is making uptime feel like one thread in that story, not a separate document stapled to the front.
Line up your reporting calendar first. If your maintenance report goes out on the first of the month, your uptime data needs to cover the exact same 30-day window, not a rolling 28 days that doesn’t match the rest of the report. Mismatched date ranges are one of the fastest ways to make a client question the whole document’s accuracy.
Placement matters more than most agencies realize. Put the uptime percentage and incident summary near the top, right after the executive summary, since it’s usually the first thing a client’s eyes go looking for. Backup status and update logs can follow underneath as supporting detail.
If you’re pulling data from a separate monitoring plugin into a broader reporting tool, check that timestamps use the same timezone convention across both. A monitoring plugin logging in UTC while your report template displays client-local time creates incident timelines that look wrong even when the underlying data is correct.
Where possible, correlate incidents with other events in the same window. A downtime spike that lines up with a plugin update in the same report immediately answers the question every client asks: “why did this happen?” That correlation is worth more than any additional metric you could add.
Customizing Reports For Different Client Technical Expertise Levels
The same uptime data needs two different report formats, sometimes three, depending on who’s reading it. A solo shop owner and an in-house IT director should never get the identical PDF.
For non-technical clients, strip the report down to three things: uptime percentage, plain-English incident summary, and the recommendation block. Skip response-time percentiles, HTTP status codes, and cause categories entirely, or push them into an optional appendix they’ll likely never open. A sentence like “your site was down for 12 minutes overnight, which didn’t affect any visitors” does more work than a chart.
For technical stakeholders, an internal IT contact or a client with development staff, give them the full dashboard link along with the PDF. They’ll want response-time breakdowns, incident cause categories, and raw timestamps to cross-reference against their own logs.
A middle tier exists too: marketing managers or operations leads who care about business impact but can handle slightly more detail than a pure summary. For this group, keep the executive summary format but add one supporting chart, usually the uptime sparkline, since a visual trend line reads faster than a percentage buried in a sentence.
Ask new clients directly, during onboarding, which tier they want by default. It saves you from guessing and prevents the awkward moment where a client feels either patronized by an oversimplified report or overwhelmed by one built for a systems administrator. Most reporting tools that support scheduled PDF delivery let you save multiple template versions, so switching between tiers doesn’t mean rebuilding the report from scratch each month.
Legal And Privacy Considerations When Sharing Uptime Data
Uptime and incident logs count as operational data about a client’s business, and how you store and transmit that data matters more than most agencies think about upfront. If a client site serves EU visitors or the client themselves is based in a jurisdiction with data-locality requirements, keeping monitoring logs on a third-party SaaS server outside that jurisdiction can create compliance questions you don’t want to field mid-contract.
Self-hosted monitoring sidesteps a chunk of that risk by default, since the data never leaves the client’s own server infrastructure. That’s a genuine argument for self-hosting beyond cost, particularly for agencies working with healthcare, finance, or government-adjacent clients where data residency clauses show up in contracts.
Put a short data-handling clause in your service agreement covering three things: how long you retain incident logs, who has access to the monitoring dashboard, and how reports are transmitted (encrypted email, secure client portal link, or password-protected PDF). None of this needs to read like a legal document. A few plain sentences in your onboarding paperwork is usually enough to cover the basics.
Be careful about what you include in status codes and error logs shared externally. Raw server logs can sometimes contain IP addresses or other visitor data that shouldn’t end up in a client-facing PDF without review. Strip anything beyond what the client needs to see the health of their site.
Why The Recommendation Line Is What Actually Keeps Clients
Most agencies treat the recommendation section as an afterthought, something to fill in after the real work of assembling metrics is done. That’s backward. The metrics prove you’re watching. The recommendation proves you’re thinking.
A single, well-prioritized recommendation changes renewal conversations more than any uptime percentage does, because it gives the client something to say yes to. “Everything’s fine” doesn’t generate a follow-up call. “We recommend moving your SSL renewal to auto-renew before it lapses again in June” does.
Here’s what to start doing this week: pick your last three client reports, check whether each one ended with a specific, single, actionable recommendation instead of a vague “let us know if you have questions,” and rewrite the ones that didn’t. Add [author_bio] context from real client work where you can, since a recommendation backed by an actual before-and-after example lands harder than a generic best practice.
— Antonio
How GrowthPlugins Helps Agencies Keep Uptime Data On Their Own Servers
If you’re weighing whether to bolt a SaaS monitoring dashboard onto your existing agency stack or keep everything under one roof, self-hosting solves a problem the SaaS route can’t: your client’s uptime history, incident notes, and report archive stay on infrastructure you control, with no recurring subscription tied to how many client sites you’re watching.
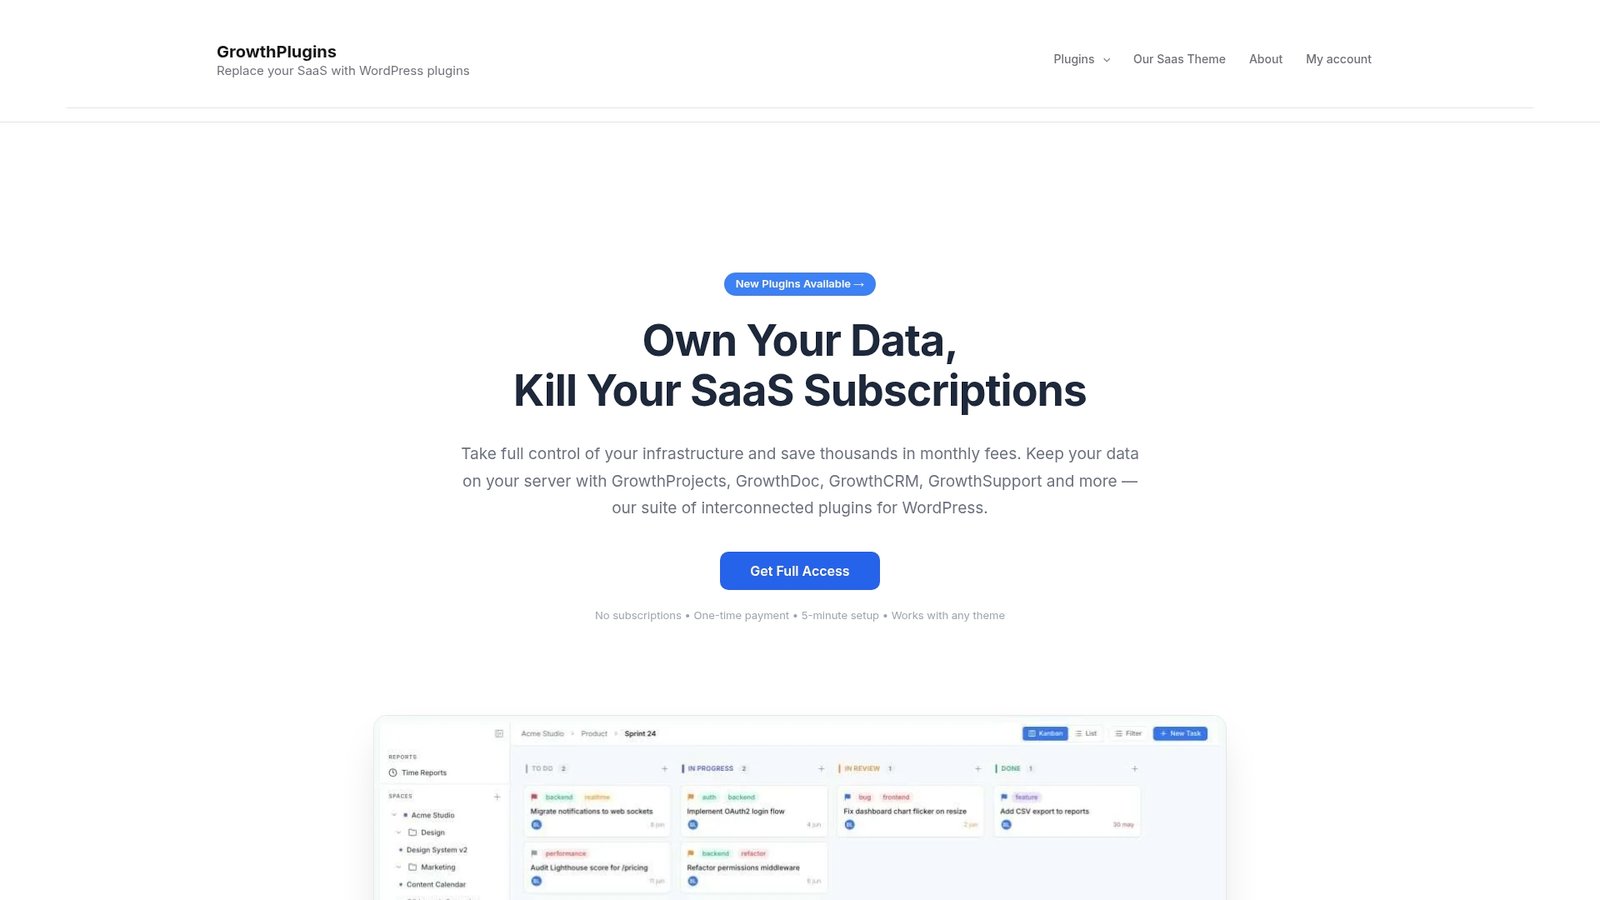
GrowthPlugins builds this into the same self-hosted dashboard agencies already use for project management, client portals, and support tickets. Uptime logs, scheduled exports, and client-facing report data live alongside the rest of your client workflow instead of in a separate tool with its own login and its own bill. That means one place to configure alerts, one place to generate a branded PDF, and one server where all of it stays.
For agencies specifically evaluating how this fits into an existing WordPress setup, the project collaboration use-case walkthrough covers how reporting and collaboration tools connect inside one dashboard. Take a look at the setup, check whether it fits how you currently deliver client reports, and start a build in under five minutes on a site you manage.
Key Implementation Resources
For plugin-level setup, SavaPato Uptime Monitor and Accelvia Uptime Monitor both cover self-hosted checks, consecutive-failure thresholds, and cron configuration in their documentation. WP Client Reports handles the reporting side, scheduled branded PDFs pulling from monitoring data.
For a non-vendor technical primer on monitoring and alerting fundamentals, the uptime monitoring guide for business owners is a useful reference. Burst Statistics’ piece on what belongs in a maintenance report covers the retention-focused recommendations framing referenced earlier.
FAQ
What Is CF7 in WordPress?
CF7 stands for Contact Form 7, a widely used free WordPress plugin for building contact forms. It’s unrelated to uptime monitoring but often shows up in maintenance reports since form submissions are a common application-path check worth monitoring.
How Do I Monitor the Uptime of a Website?
Use a monitoring tool that sends scheduled HTTP checks to your site and application-critical pages like checkout or login, then set consecutive-failure thresholds before triggering an alert. Self-hosted WordPress plugins like SavaPato or Accelvia handle this directly from your own server, while paired server-side cron keeps check intervals reliable on low-traffic sites.
Is There an Audit Log in WordPress?
WordPress core doesn’t include a built-in audit log, but dedicated plugins can track user actions, login attempts, and content changes. This audit trail complements uptime monitoring by helping you correlate downtime incidents with changes made around the same time.
How Can I Monitor My WordPress Traffic?
Traffic monitoring typically comes from analytics plugins or server log analysis tools, separate from uptime monitoring, though both feed into a complete client report. Combining traffic data with your incident timeline helps show whether an outage actually affected visitors or happened during a quiet period.
How Often Should I Send a Client Uptime Report?
Monthly is the standard cadence for a branded uptime report, paired with a live dashboard link for clients who want more detail between cycles. Any high-severity outage should trigger an immediate notification outside the regular monthly schedule, not wait for the next report.