Monitoring for the sites you manage
WordPress Uptime Monitoring Across Your Client Sites
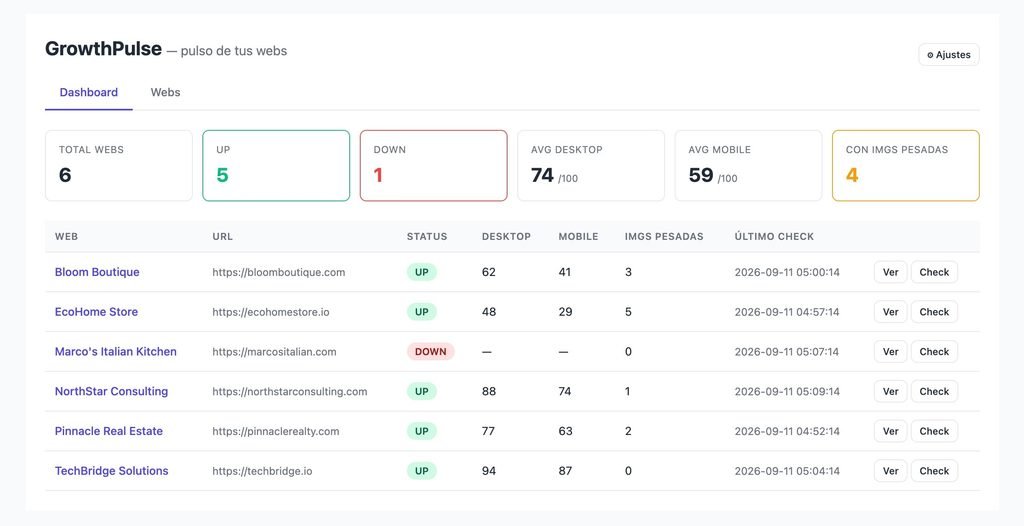
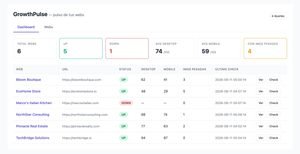
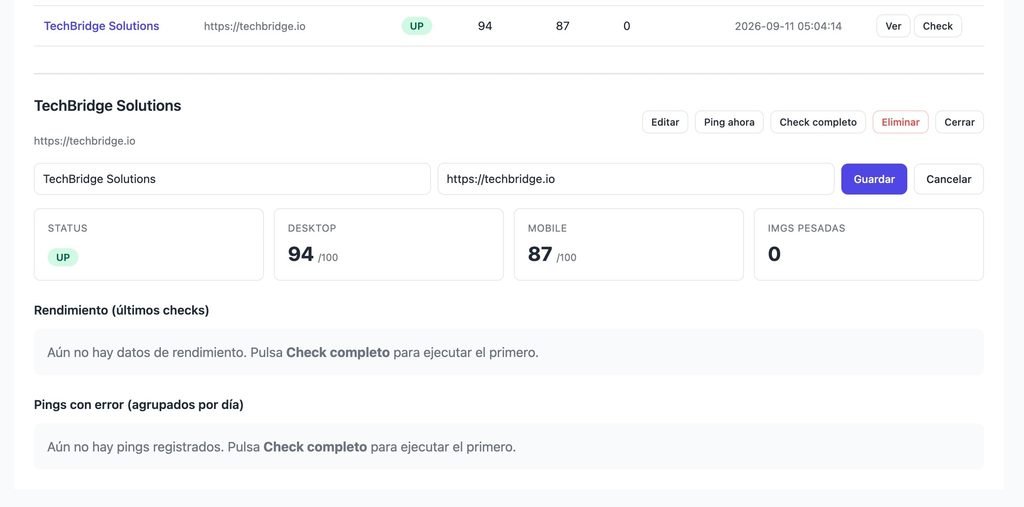
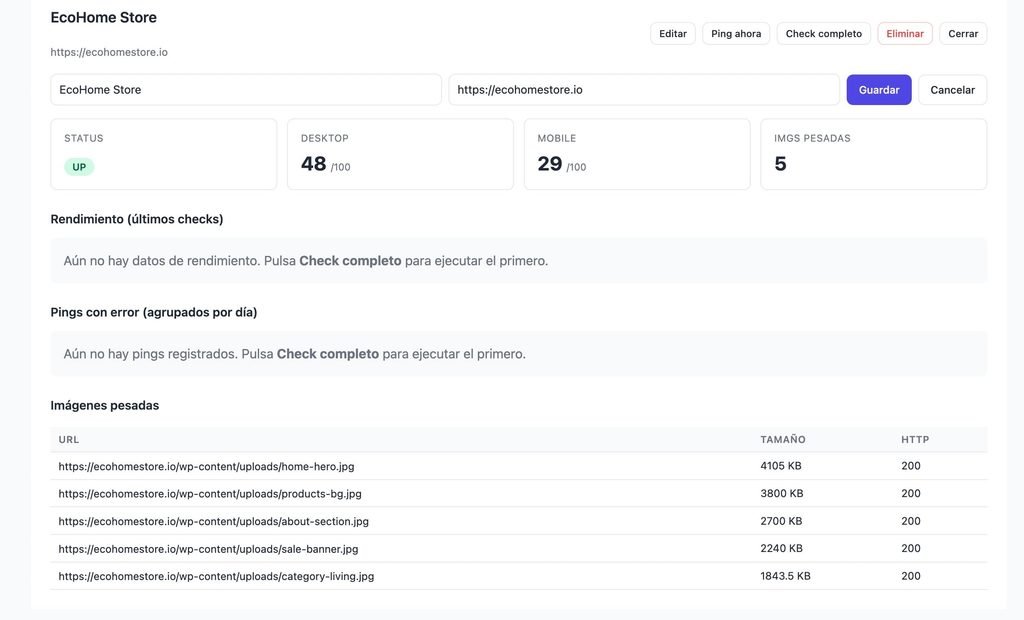
One dashboard for every site you manage
Drop the [growthwebmonitor] shortcode on a page and get an agency-wide control panel: aggregated metrics, a live status table, and a click-through detail view with interactive charts.
- Dashboard & Webs tabs — overview plus full site CRUD
- Inline detail panel with performance & error-ping charts (ApexCharts)
- Also manageable from the native wp-admin menu
Uptime monitoring around the clock
An hourly cron pings every site over HTTP and records the result. When a site goes down, GrowthWebMonitor waits for three consecutive failures before emailing you — so you hear about real outages, not blips.
- Hourly HTTP ping with full history
- Email alert after 3 consecutive failures
- Error pings charted by day in the detail view
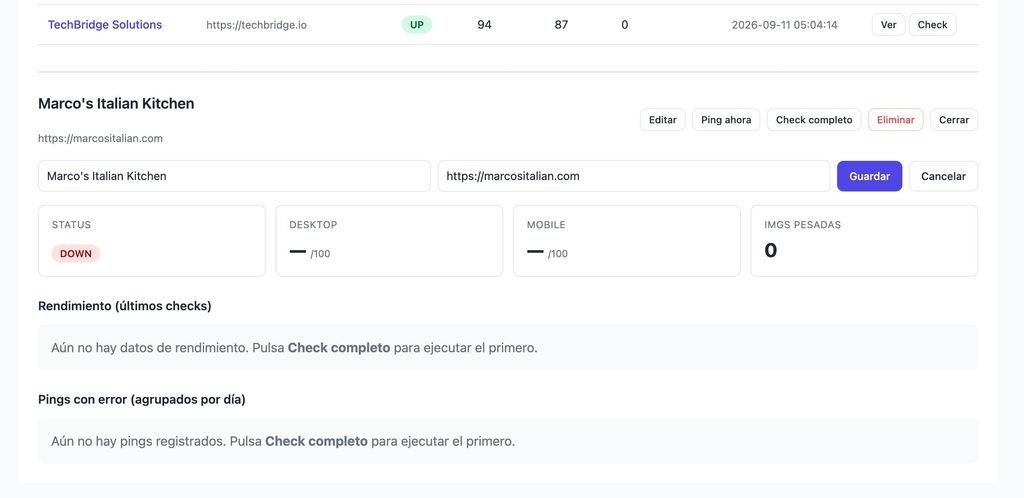
PageSpeed performance, tracked daily
Every day GrowthWebMonitor runs Google PageSpeed for desktop and mobile on each site and stores the scores. Set your own thresholds and get an email the moment a site drops below them.
- Daily Google PageSpeed, desktop & mobile
- Custom performance thresholds per device
- Historical score trend in the detail charts
Image-weight audits & a REST API
A daily scan flags oversized or broken images on every site so nothing silently bloats a page. And a token-secured REST API exposes status, performance and ping history for your own dashboards and automations.
- Daily image scan: oversized & error images logged
- REST API at
/wp-json/growthwebmonitor/v1with a global token - Force any check manually from Settings
Up and Running in 3 Steps
1
Install & Activate
Upload GrowthWebMonitor and activate it. The monitoring tables are created and the uptime, PageSpeed and image crons are scheduled automatically.
2
Add the Shortcode
Create a page and paste [growthwebmonitor] for the dashboard, then add your PageSpeed API key and alert emails in GrowthWebMonitor → Settings.
3
Add your sites
Open the Webs tab, add each site you manage, and GrowthWebMonitor starts collecting uptime, performance and image data on its own.
GrowthWebMonitor Free vs. SaaS Alternatives
See how GrowthWebMonitor stacks up against paid monitoring tools.
| Feature | GrowthWebMonitor | UptimeRobot | Pingdom | Better Stack |
|---|---|---|---|---|
| Self-hosted, runs on your WordPress | ✓ | ✗ | ✗ | ✗ |
| You own 100% of your data | ✓ | ✗ | ✗ | ✗ |
| Uptime / ping monitoring | ✓ | ✓ | ✓ | ✓ |
| Daily PageSpeed (desktop & mobile) | ✓ | ✗ | Partial | Partial |
| Image-weight audits | ✓ | ✗ | ✗ | ✗ |
| REST API & manual checks | ✓ | Add-on | Add-on | Add-on |
| Monthly fee | None | $7–34 | $10–60 | $25+ |
AI-Ready
Built for the agentic web. Native to WordPress 7.
GrowthWebMonitor exposes its full monitoring surface through the new WordPress Abilities API. Any AI assistant, MCP client or automation can discover, schema-validate and safely query your sites, trigger on-demand checks, and read performance diagnostics — with the same capability checks your team already uses.
WordPress 7.0+
Abilities API
MCP-compatible
JSON Schema typed
Capability-aware
What your AI can do
| Category | Abilities | Sample |
|---|---|---|
| Sites | 5 | get-sites / add-site |
| Checks | 3 | ping-site / check-site |
| Diagnostics | 7 | get-dashboard-summary / get-sites-down |
- Ask in plain language. “Which sites are down right now?” or “Run a full check on site #3 and show me the PageSpeed score”.
- Safe by design. Every ability declares readonly, idempotent or destructive intent.
- Your permissions still apply. Each call goes through WordPress capabilities.
- Tune it from wp-admin. Decide which abilities are exposed to MCP clients.
15 typed abilities across 3 categories, registered under the growthwebmonitor/* namespace. Requires WordPress 7.0+.
WordPress Uptime Monitoring with Status History and Email Alerts
Watch every site you’re responsible for from a single WordPress install.
Agencies
Monitor every client site from one place and catch outages or performance drops before your clients do — no per-site SaaS bill.
Freelancers & maintainers
Offer a maintenance plan backed by real uptime and performance data, with email alerts that let you act fast.
In-house web teams
Keep a portfolio of internal properties healthy and feed the REST API into your own dashboards and automations.
Frequently Asked Questions
Do I need a Google PageSpeed API key?
Yes, for the performance checks. PageSpeed scores come from Google’s API, so you add a free API key in Settings. Uptime pings and image audits work without it.
How many sites can I monitor?
As many as you like — there are no site limits. GrowthWebMonitor is single-tenant: every site belongs to your installation and shares one global configuration and one API token.
Who owns my data?
You do — completely. All logs, pings and image records live in your own WordPress database. Nothing is sent to a third-party monitoring SaaS.
Can I integrate it with other tools?
Yes. A token-secured REST API at /wp-json/growthwebmonitor/v1 returns site status, PageSpeed history and ping history, so you can pipe the data into your own dashboards or automations.
Who can access the dashboard?
By default the [growthwebmonitor] dashboard and Settings are limited to administrators (manage_options). To give non-admin staff access, grant that capability with any roles & capabilities plugin.